Cycling prediction method
The cycling predictions by Mortirolo are purely based on a statistical model, not on (expert based) opinions. The method used is a combination of Bayesian modelling and machine learning. The statistical model uses the results of the same (type) of races during the last ten years to determine which individual and team characteristics are important predictors for the classification of that race. Subsequently, the statistical model is used to run 10000 simulations of a race and produces probabilities for each rider to win, end up on the podium and in the top 10 and a predicted classification.
From simulations to prediction
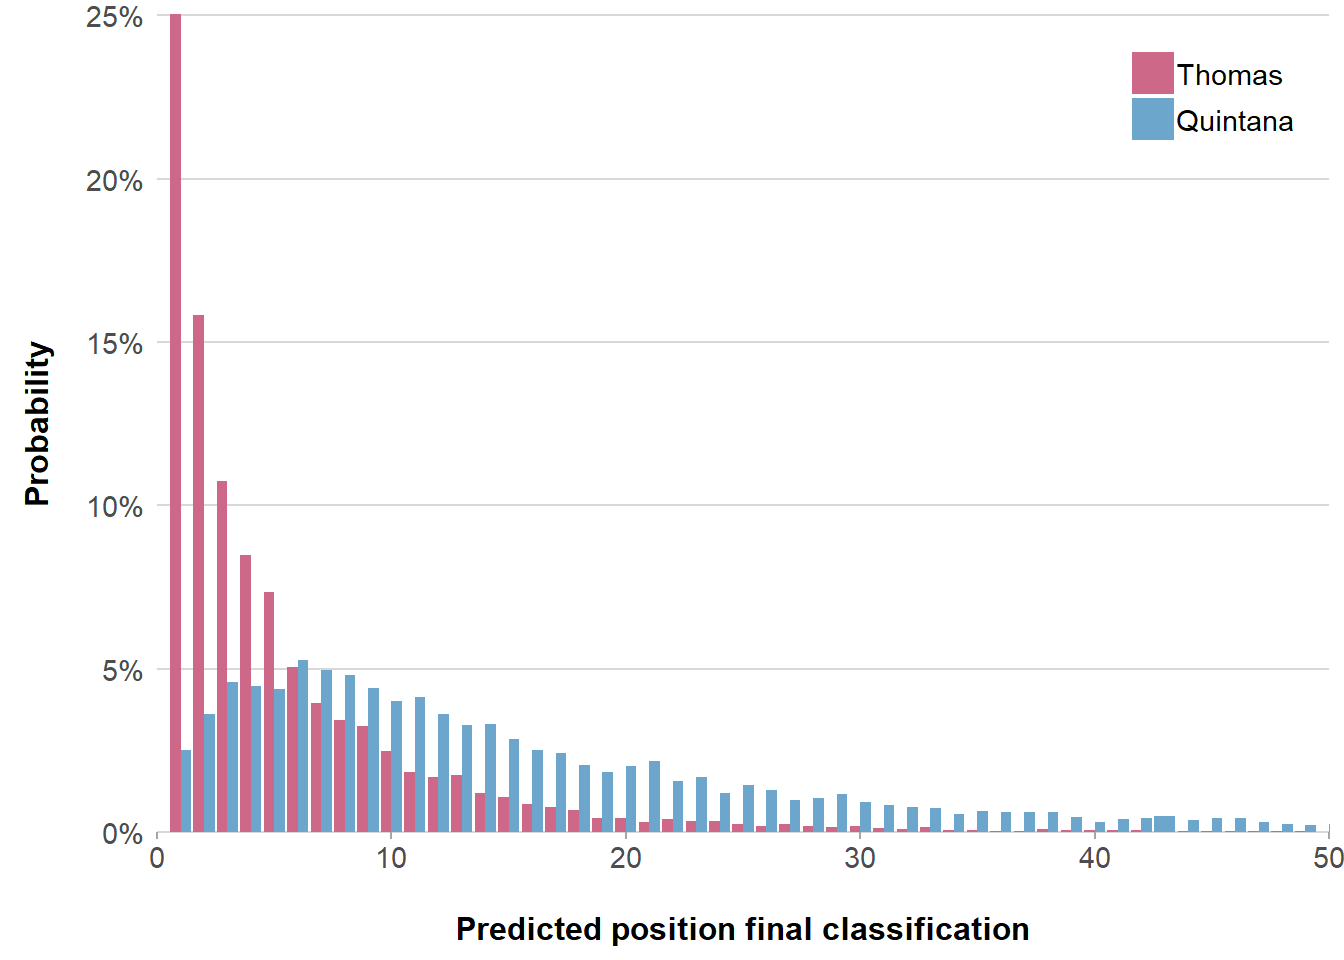
Each simulation produces a classification of that race. The probability a cyclist wins a race is calculated as the percentage the cyclist ends up on top in those 10.000 simulations. For instance, figure 1 shows the probability distribution of Geraint Thomas and Nairo Quintana to end up on a position in the final classification of the Tour de France 2019. Thomas has high probabilities to end up in the top five positions. The simulations of Quintana’s final position are more spread out, but maximize between position 5 and 10. The average of all predicted positions is used to calculate the predicted order of the classification. Each simulation is different because the model takes the historical uncertainty of the influence of the predictors on the classification into account.
Figure 1: Probability per position of Thomas and Quintana for Tour de France 2019
Data
The prediction process starts with over 100 variables. The basis of those variables are the cycling skill ratings calculated by Mortirolo, that gives up to date estimates of a riders skill in different types of races. Next, there are estimates about the shape during races the last 1, 3 or 6 weeks (in general and for particular types of skills). Results of the last 3 years of the particular race are also used as predicating variables. Also the ranking in the team is used (for different types of races). Being the team leader gives more chance to end up high in the classification than being a helper. This position is determined by the Skill Rating. Finally, also the quality of the team is used. The sum of Skill Ratings for different types is calculated for this (the best four riders).
Figure 2: Variable importance most important predictors Tour de France 2019
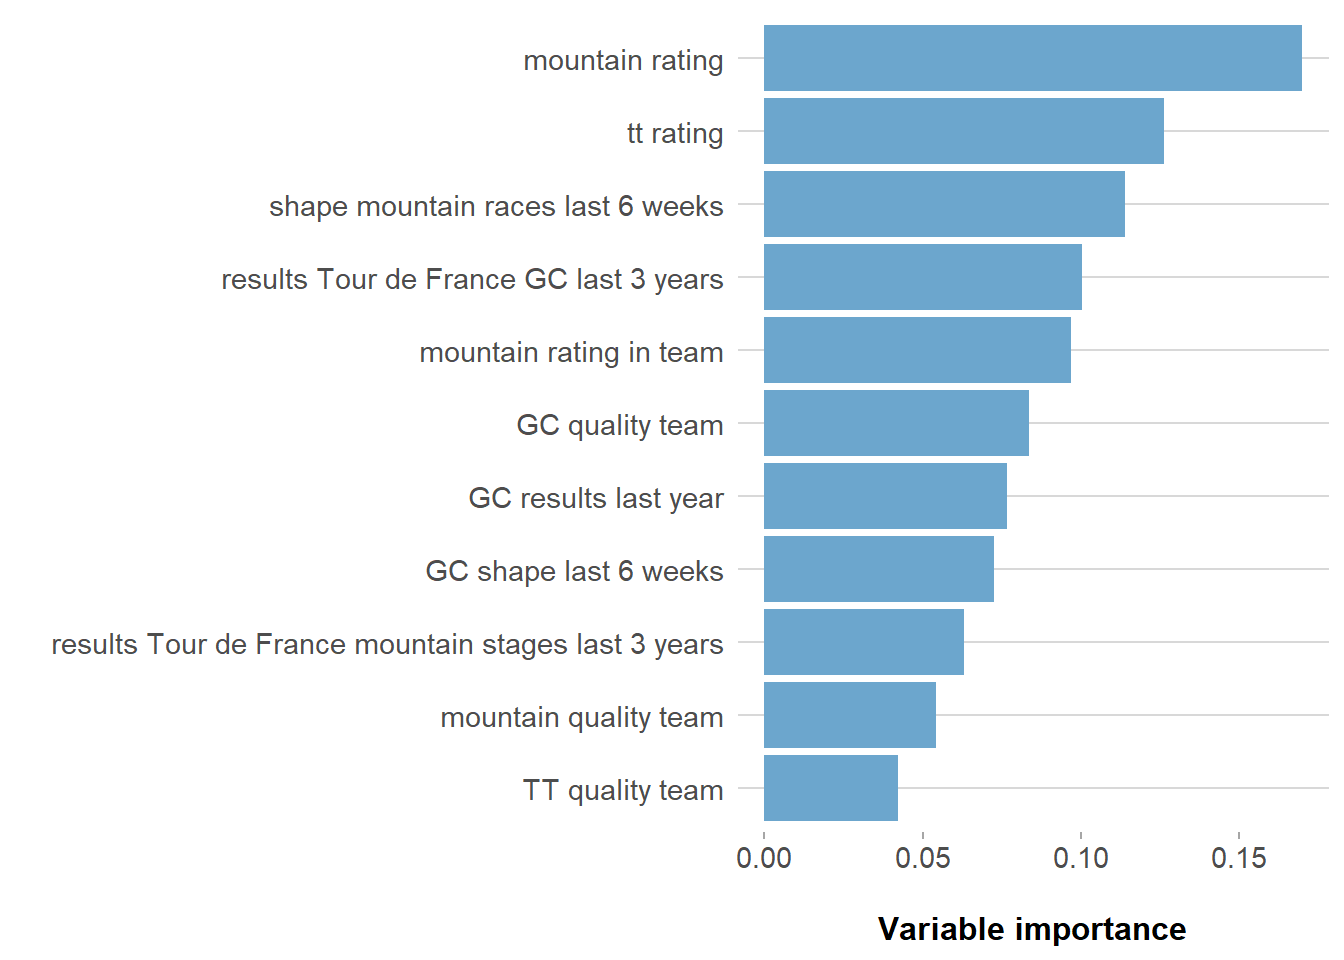
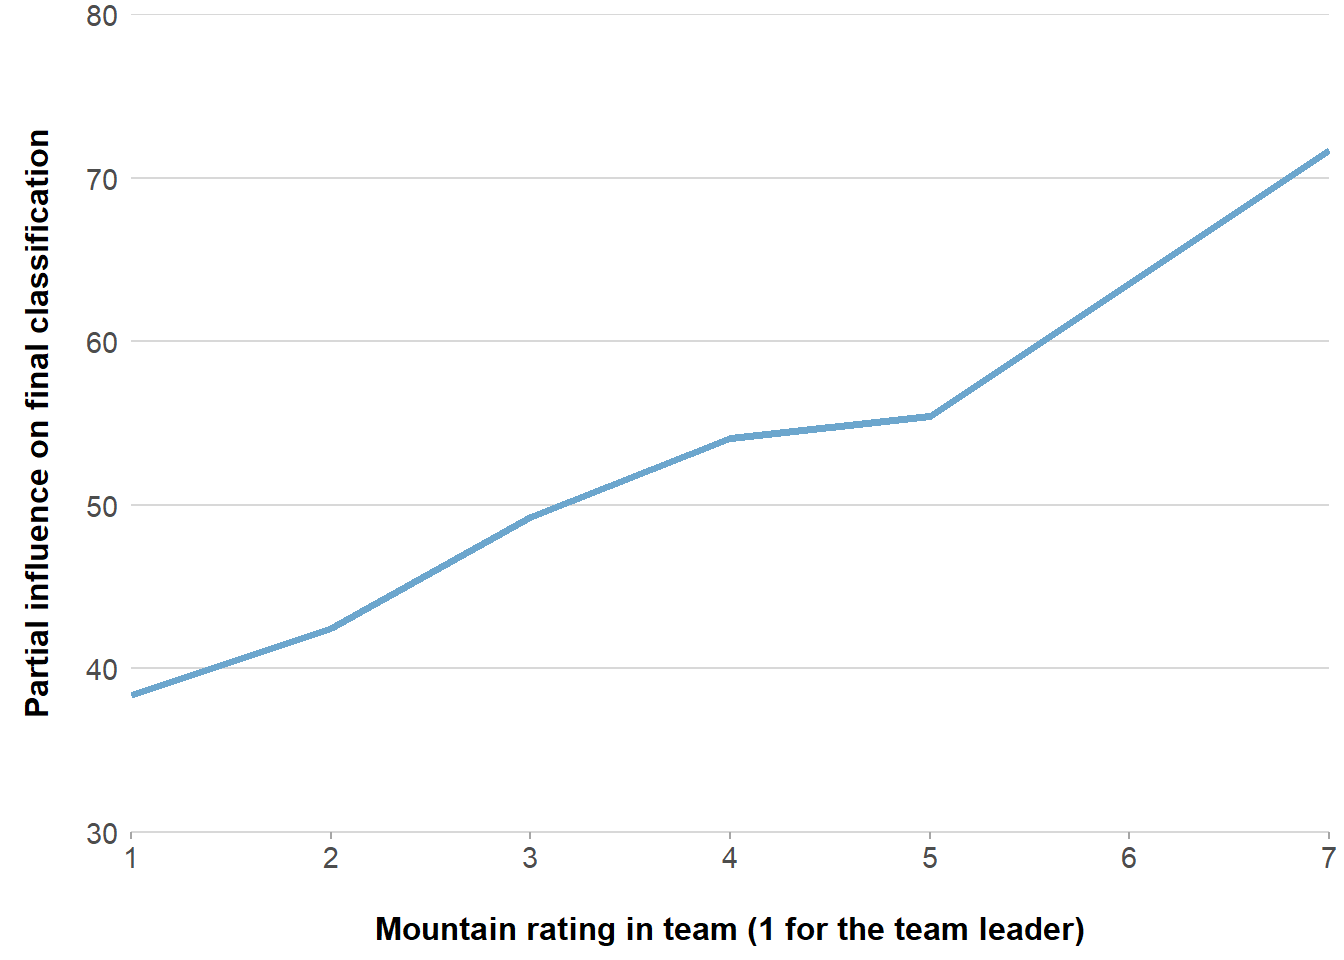
In the end the 10 to 15 best predicting variables are the input for the model. Figure 2 shows for instance the best predicting variables and their importance to predict the Tour. The mountain rating of riders is the most important quality that predicts a riders final position in a Grand Tour. The time trial qualities of the team only the 11th. Figure 3 shows how the ranking in the team for mountain races influences the classification (1 for the rider with the highest mountain rating in the team, 2 for the second et cetera). The leader of a team on average ends up 4 places better in the final classification - controlled for other qualities of the riders - than the second climber in the team.
Figure 3: Being the best climber in the team leads to better final classifications in Grand Tours (controled for other variables)
Similar races during the last ten tears on a comparable level are selected for the model. For instance: the final classifications of Giro, Tour and Vuelta are used to predict the final classification of the Tour, or cobble stone races in de World Tour to predict Paris-Roubaix.
Method
The method used is a Bayesian approach to tree based machine learning. Bayesian Additive Regression Trees (BART) is a relative new method introduced by Chipman, George, and McCulloch in 2010. It uses the idea of tree based machine learning methods like Random Forest or Gradient Boosting. Those methods ensembles lots of decision trees to make better predictions. Individual a decision tree is often a weak learner, but when combined they can have high predictive value. BART is most comparable with Gradient Boosting methods, but the estimation approach relies on Bayesian probability model. As a Bayesian model, a set of priors is used (instead of the previous tree in a Gradient Boosting method). They make sure no single tree can dominate the total fit of the model.
BART is a nonparametric estimation, opposed to a ‘normal’ ols-regression, which uses parameters for all variables to make a prediction for the dependent variable. With the combination of Bayesian modelling and a sum-of-trees ensemble method, BART is better able to capture interactions and non-linearities as well as additive effects. Next to the high predictive quality of this approach, the big advantage is the prediction is also probabilistic. In this case 10.000 simulations are run to calculate the possibility each rider wins. For instance, this makes it possible to show if there are many close favourites, or 1 big favourite.